
The Art of Map Reading – Visualizing Terrain Beyond the Lines and Colors.
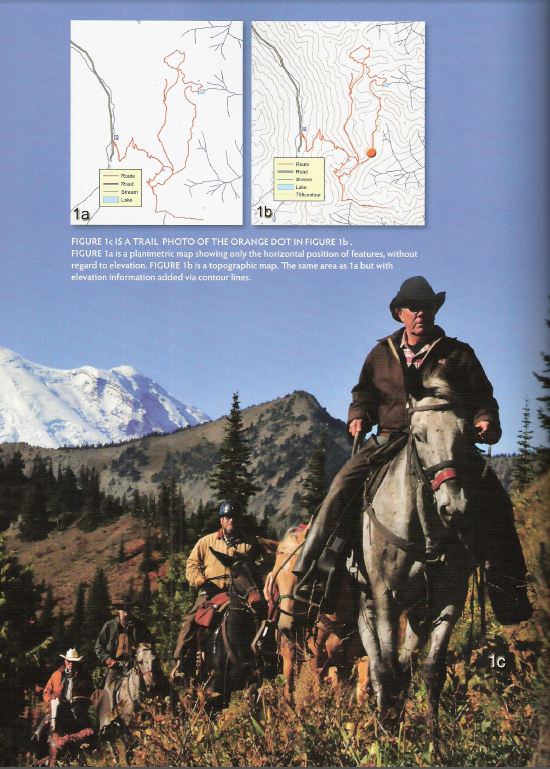
•In #1a – The planimetric map shows only the horizontal position of features, without regard to elevation.
•In #1b you see the same area but with elevation information added via contour lines. This is a topographic map.
•Figure #1c is a trail photo taken near the orange dot in figure #1b. A good understanding of how to read a topographic map makes riding in these areas much safer.
Are you ready and confident in your ability to find your way safely through the mountains and return in time for dinner? When your destination is remote one of most important skills to learn and be proficient at, is how to read your map. Knowing how to interpret a map helps in planning a trip by allowing you to “see” the terrain prior to your ride. While most people do carry a map, and sometimes even a compass, I find that quite often these vital tools are carried more as lucky charms intended to make the rider feel better about their ride. Take the time to learn how to properly read and interpret your map. Failure to do so could prove annoying at best and disastrous at worse should you become separated from your group and your horse in the back country.
I teach a number of land navigation classes each year designed to help horse riders “Stay Found” while on the trail and beyond. I’ve found some common issues and misconceptions about map reading. So with that in mind…
Types of maps – They all have their purpose
What type of map is best suited for horse riders? All maps do essentially the same thing; they attempt to describe our three dimensional world on a two dimensional piece of paper. They accomplish their mission by selectively including the data that is most important to the end user. There are many types of maps, ranging from a simple sketch of the trails at your local
county park, to the travel atlas tucked under your truck seat, to highly detailed USGS topographic maps. For example the typical motorist really isn’t too concerned with where a hill or valley is located, but is much more concerned with where the next exit for a gas station may be. For those of us whose preferred form of transportation is a horse or mule, however, need to have information that shows us elevation changes and potential obstacles (such as streams and canyons) as they relate to where we ride. For that type of information you need a topographic map that deals with the third dimension (height or elevation) by using contour lines to show elevation change on the surface of the earth.In figures #1a and 1b are examples of a typical planimetric, or road map, and a topographic map for the same area in the central Cascades. Both show the relative locations of a parking area, trail route, and water features. But, only one is suitable for planning a safe back country ride.
Contour Lines – Using these curvy, wavy lines to visualize terrain and land features long before you hit the trail
What’s with those wavy crazy light brown lines that wander all over your topographic map?
These are called contour lines and they connect areas of constant elevation. If you were able to see and follow a contour line while on the trail you’d stay at the same elevation, neither gaining nor losing altitude, as long as you stayed on that line. Keep this concept in mind when you look at a trail map. When the trail crosses many closely spaced contour lines you’ll know that you’ve got some steep climbs or descents ahead. Is your mount conditioned for the grade? Likewise, when you see a large amount of space between the contour lines you’ll know that the terrain is relatively flat and perhaps suitable for all levels of riders and horses. And when the trail runs parallel to many closely spaced contour lines you’ll know that you’ll be traveling on a ledge, with steep walls above and below.
A few helpful rules to remember about contour lines include:
- Contour lines can never cross one another. Each line represents a separate elevation.
- Moving from one contour line to another always indicates a change in elevation.
- The closer contour lines are to one another, the steeper the slope is in the real world.
- Contour lines forming a closed ring shape indicate a summit or ridge
- Contour lines crossing a stream valley will form a “V” shaped pattern pointing in the uphill (and upstream) direction.
As you become more comfortable in reading a topographic map you’ll be better able to visualize the lay of the land prior to your trip which will help tremendously in planning your adventures.
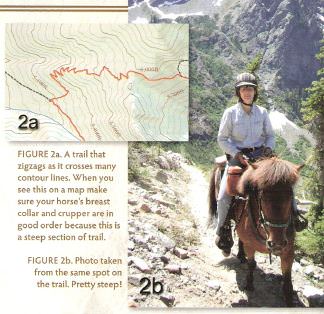 Figure #2a shows a trail that zig zags as it crosses many contour lines. When you see this on a map you’ll know to make sure that your breast collar and crupper are in good order because this is a steep section of trail.
Figure #2b is a photo taken from the same spot on the trail. Pretty steep!
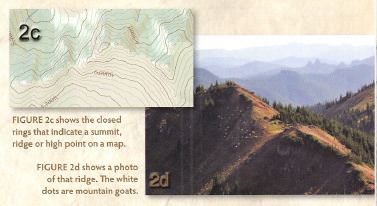
Figure #2c shows the closed rings that indicate a summit, ridge, or high point on a map. Figure #2d shows a photo of that ridge. The white dots are mountain goats.
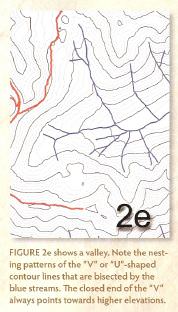 Figure #2e shows a valley. Note the nesting patterns of the “V” or “U” shaped contour lines that are bisected by the blue streams. The closed end of the “V” always points towards higher elevations.
A map’s instruction manual – Why marginal information isn’t marginal at all
Beyond understanding an area’s topography via contour lines, you can learn even more by reading your map’s legend. Since a map’s entire purpose is to represent a three dimensional world at reduced scale on a two dimensional piece of paper, we must learn what the myriad of symbols mean. These symbols go far beyond the aforementioned light brown contour lines and, of course, blue ink for water bodies. Fortunately, all maps should have a map legend defining the symbols that are represented therein. Typically found on the edges of your map (thus the title Marginal Data) these symbols will further help you to visualize what’s on the other side of the ridge far ahead. An instance where this will help trail riders is finding water. By reading your map properly you’ll know where easily accessible water can be found for your thirsty horses and mules.
Other very important marginal data includes:
- Revision date – When was your map updated or how current is your map? Your map may have been great a few years ago but in the interim many things can change. Trails can be closed or moved; roads can be decommissioned, or built, and rivers and streams can find new routes.
- Legend – It illustrates and identifies the topographic symbols used to depict some of the more prominent features on the map. The symbols are not always the same on every map so you should always refer to the legend to avoid errors when reading your map.
- Bar Scales – These are just rulers used to convert map distance to ground distance.
- Contour Interval Note – Defines the vertical distance between adjacent contour lines of the map
- Declination Diagram – Depicts the angular relationships of true north and magnetic north.
- Figure #3a shows marginal data including a scale bar, map legend, and a declination diagram.
- What is North – Why your map points to a different north than your compass and how to compensate for it.
- Other very important data that can be found in a map’s margins includes declination (the difference between where your compass points and your map’s version of north) and a north arrow that will help you in orienting your map while on the trail. This is always a fun topic and starts to move the conversation from using the map to how your compass works.
Maps are based on the geographic north pole because it does not change, so north is always at the top of a map. The main north arrow, vertical lines, if any, and the top of your map all point towards the north pole. However, your compass has a mind of its own and points to magnetic north. Magnetic north, Santa’s Elves notwithstanding, changes slowly over time (about forty miles per year), and is currently about 450 miles from the geographic north pole, northwest of Hudson’s Bay in northern Canada. It’s this angular difference between the geographic and magnetic norths that constitutes declination. To make matters even more interesting, declination varies across the nation.
If you fail to use the declination diagram on your map to compensate for the difference between geographic north and magnetic north, you could very well end up spending a much longer time in the saddle than you had planned.
To illustrate how failure to adjust for declination can cause you many problems.
For each degree of declination that we fail to take into account we will be off our mark by 92 feet after riding for a mile. If you’re riding in the Pacific Northwest, as I frequently do, it’s common to have declinations of 17 degrees east, which means that your compass is pointing 17 degrees east of the north that your map is referring to. If I don’t take those 17 degrees into account I could, potentially, be 1564 feet (or almost one third of a mile) off course after riding for just one mile. That amount of error could very easily have me going into a wrong valley and perhaps be very very late for dinner.
There are many methods to adjust for declination and most of them involve adjustments to your compass via manually rotating the compass bezel the correct number of degrees in the proper direction or memorizing a few mathematical equations. I do not recommend adjusting your compass for the following reason; if you’re mathematically challenged and forget either to adjust in the right direction, or do not keep your compass updated it’s very easy to generate a bad reading. Instead, I advocate altering your map to reflect declination. By adding magnetic north –south lines to your map you’ll have a ready reference that is always there. Adding these lines requires a pencil, straight edge, a protractor, and the area’s declination measurement.
By using this map preparation method you are transferring the job of adjusting for declination to the map. The lines of magnetic reference are permanently drawn on the map, where they belong, instead of temporarily adjusted on the compass where it is subject to change as you change location from map to map. Once magnetic north lines are drawn on the map, the map is adjusted for declination whenever you next use it without worrying about performing declination math in the field.
To make these magnetic north lines all you have to do is place a protractor on the edge of your map rotate it to the degrees indicated in the declination diagram and use a straight edge ruler to draw a line along the angle. Adding a few more parallel lines will make using the map easier on the trail.
 Figure 4a shows a map that has had declination lines drawn, which makes using a compass much easier.
Now that you’ve got the basics of reading a map you’ll want to practice, practice, practice your new found skills. Take the time, before and during, your next ride to stop and examine your map and see if it accurately portrays what’s around the corner or over the next hill. Pretty soon you’ll be navigating the back country wilderness.